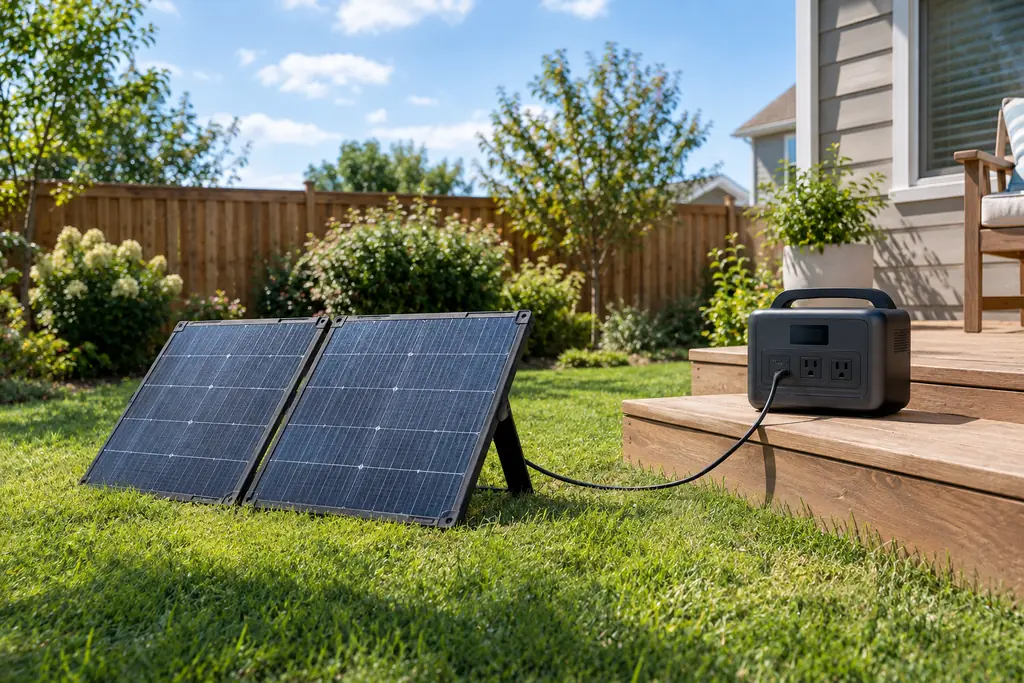
Why battery size alone does not set the panel count
A power station's battery is rated in watt-hours, the energy it holds. A solar panel is rated in watts, the power it produces in full laboratory sun. Getting from one to the other needs a third number: how many watt-hours those panels produce over a day in your place and season. This post keeps the three apart.
A DOE and NREL report on solar performance (2021) explains the gap between the label and the yard. Panels are rated at standard test conditions of 1,000 W of sunlight per square metre and a 25°C cell. Outdoors, the sunlight is usually weaker and the cells usually hotter, and output falls as the temperature rises. Jackery's SolarSaga 200W, for example, is rated at 200 W ±5% under those test conditions, and it delivers less than that for most of the day.
The energy a full recharge needs
To refill a station from empty, the panels have to produce at least its rated capacity in watt-hours, plus whatever the station loses while charging. A 1,024 Wh station needs more than 1,024 Wh of solar energy, and a 3,584 Wh one more than 3,584 Wh.
To estimate what panels produce, we used PVWatts, the Energy Department's solar calculator now run by the National Laboratory of the Rockies (NLR). We modelled 400 W of fixed panels facing due south at a 30° tilt, with PVWatts' default 14% system losses and typical-year weather for four cities. Average daily output came out like this:
| City | June, Wh per day | December, Wh per day |
|---|---|---|
| Phoenix | 2,172 | 1,697 |
| Houston | 1,677 | 1,209 |
| Chicago | 1,856 | 842 |
| Seattle | 1,702 | 486 |
One limit applies to every figure in this post. PVWatts models a rooftop system's AC output through a grid inverter, not a portable station charging through its own solar controller. The station's own charging losses aren't in these numbers, and there's no published factor to convert them, so the energy stored will be lower by an amount PVWatts can't tell you.
Panel watts for 1, 2 and 3 kWh, with the maths shown
From that table, we worked out the panel watts whose average daily output equals 1,000, 2,000 or 3,000 Wh. The sum is the target watt-hours times 400, divided by the city's daily output. For Chicago in December, that's 1,000 × 400 ÷ 842 ≈ 475 W.
| City and month | 1,000 Wh | 2,000 Wh | 3,000 Wh |
|---|---|---|---|
| Phoenix, June | 184 W | 368 W | 552 W |
| Phoenix, December | 236 W | 471 W | 707 W |
| Houston, June | 239 W | 477 W | 716 W |
| Houston, December | 331 W | 662 W | 993 W |
| Chicago, June | 216 W | 431 W | 647 W |
| Chicago, December | 475 W | 950 W | 1,425 W |
| Seattle, June | 235 W | 470 W | 705 W |
| Seattle, December | 823 W | 1,646 W | 2,469 W |
Treat these as the floor, not the answer. They're our arithmetic on a typical day, before the station's charging losses, with the panels aimed well and nothing shading them.
Sun hours, weather and losses
"Peak sun hours" are the same idea in another unit. An NLR slide deck (2024) notes that a kilowatt-hour of sunlight per square metre is sometimes called a "sun-hour", and that midday summer sun in a sunny place peaks at about 1 kW per square metre. A day with 5 sun-hours delivers as much light as 5 hours of that peak.
Individual days wander from the average. PVWatts' own help pages say monthly output may differ from the long-term average by about 30%, and by as much as 40% for individual months. They also say the estimates may be too optimistic if panels are shaded, or if soiling or snow costs more than 5%. A cloudy week can fall well below the table above. Jackery's manuals put it simply: solar charge times depend on the weather, so place panels where they get as much direct sun as possible.
Your station's solar limits: watts, volts and amps
The station's solar input decides how much of the panels' power it can take at once. Panel watts above that limit add nothing at peak. These are the makers' figures for current models:
- Jackery Explorer 1000 v2 and Explorer 2000 v2: 400 W across two inputs
- Jackery HomePower 3600 Plus: 1,000 W, with panel open-circuit voltage inside 16 to 60 V
- EcoFlow DELTA 3 Classic: 500 W; DELTA 3 Plus: 1,000 W (500 W per port, 11 to 60 V, 15 A)
- EcoFlow DELTA Pro 3: 2,600 W, split between a 1,600 W high-voltage and a 1,000 W low-voltage input
- Anker SOLIX C1000 Gen 2: 600 W (11 to 60 V); SOLIX F3800 Plus: 3,200 W across two 1,600 W inputs
- BLUETTI AC180: 500 W; Elite 200 V2: 1,000 W (12 to 60 V, 20 A)
Voltage is the limit people miss. Panels wired in series add their voltages, and the total open-circuit voltage has to stay inside the station's range. Two SolarSaga 200W panels at 22 V each make 44 V, inside a 60 V limit; a third would make 66 V, over it. Our power station database lists every model's solar watts, volts and amps.
Summer and winter, side by side
In summer the four cities are close: in June they produce between 1,677 and 2,172 Wh a day from 400 W of panels. By December, Phoenix still makes about 80% of its June output, while Seattle makes under a third. Chicago falls from 1,856 to 842 Wh a day.
That matters most for winter outages, which is when many people need the station. In Chicago the same panels need more than twice as many December days as June days to collect the same energy, before any cloudy spell. Our winter storm plan covers recharging options and checking the charging temperature limits in your manual.
When a full recharge in one day is not realistic
Even in perfect sun, the input limit sets a minimum time. A Jackery Explorer 2000 v2 holds 2,042 Wh and takes at most 400 W of solar, so it needs at least 5.1 hours of full input. A HomePower 3600 Plus holds 3,584 Wh at up to 1,000 W, so at least 3.6 hours. Both figures assume full input from the first minute to the last, which the sun doesn't give.
The makers' own charge times are best cases too. Jackery's calculator gives the Explorer 1000 v2 3.8 hours with two SolarSaga 200W panels, from lab tests, which works out to about 280 W on average from 400 W of panels. BLUETTI's Elite 200 V2 manual says about 2.4 hours, but only with a continuous 1,000 W arriving at the input. EcoFlow quotes 70 minutes for the DELTA 3 Plus on two 500 W inputs, from its internal testing, and Anker quotes 1.8 hours for the C1000 Gen 2 with 600 W of solar, with no conditions stated. Each assumes the input stays near its maximum the whole time.
A large station in winter, a northern city or a cloudy spell all push a full recharge past one day. For those cases, solar works better as a top-up next to the station's other charging options; our guide to backup without solar covers that. If you're buying a station and panels together, our solar generator picks compare kits by battery size and solar input.
Questions readers ask
How many solar panels does it take to charge a 1,000 Wh battery?
On PVWatts' typical-year model, about 184 W of panels in Phoenix in June produce 1,000 Wh on an average day, and about 823 W in Seattle in December. The station stores less than the panels produce, so plan above those figures.
Will solar panels charge a power station on a cloudy day?
More slowly. Jackery's manuals say solar charge times depend on the weather, and PVWatts warns that a single month can run as much as 40% away from its average. EcoFlow's DELTA 3 Plus has an indicator for when its low-light protection is triggered.
How much faster is 400 W of panels than 200 W?
Jackery's calculator gives the Explorer 1000 v2 7.5 hours with one SolarSaga 200W panel and 3.8 hours with two, from lab tests. Adding panels helps until you reach the station's solar input limit, which is 400 W on that model.
Can I connect more panel watts than the station's solar input limit?
The station takes no more than its rated input, so panel watts above the limit add nothing at peak. The panels' combined voltage and current also have to stay inside the ranges in the station's manual.
Sources
- PVWatts Calculator (version 8), National Laboratory of the Rockies (NLR)
- PVWatts V8 API documentation, NLR Developer Network
- PVWatts help: Cautions for Interpreting the Results, NLR
- PVWatts help: System Losses, NLR
- Technology Tips for Solar + Storage REAP Application Reviews (NREL/PR-7A40-90582, 2024), slide 6, NREL
- Understanding Solar Photovoltaic System Performance (2021), U.S. Department of Energy FEMP and NREL
- SolarSaga 200W Solar Panel (tech specs and charge-time calculator), Jackery
- Jackery Explorer 1000 v2 User Manual, Jackery
- Jackery Explorer 2000 v2 User Manual, Jackery
- Jackery HomePower 3600 Plus User Manual, Jackery
- BLUETTI Elite 200 V2 User Manual V2.0 (section 4.2), BLUETTI
- EcoFlow DELTA 3 Plus product page (US), EcoFlow
- EcoFlow DELTA 3 Plus User Manual (US), EcoFlow
- Anker SOLIX C1000 Gen 2 product page (US), Anker SOLIX